Scatter
A circle, square or star per datum, all in one path.
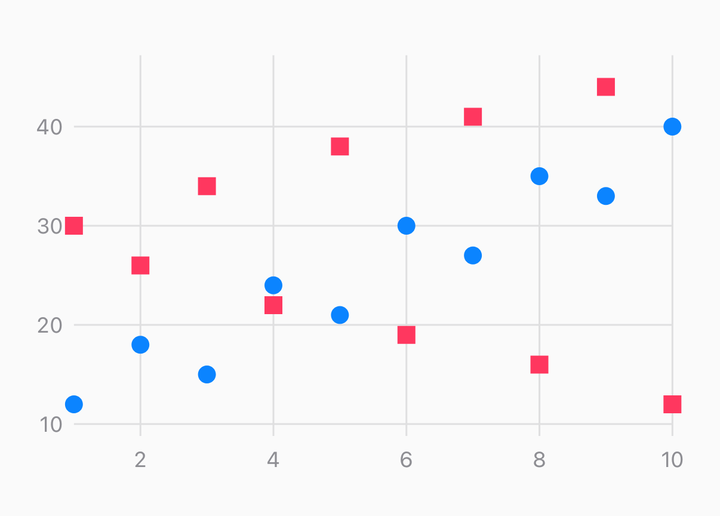
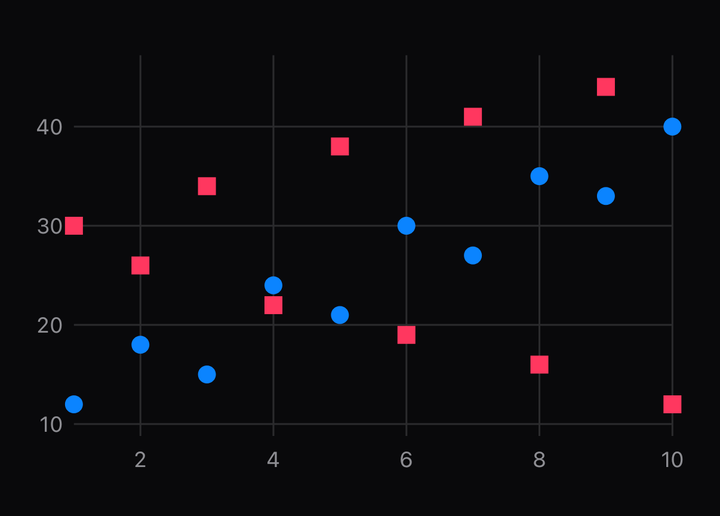
import { CartesianChart, ChartGrid, ChartScatter } from "@delacour/react-native-charts";

<CartesianChart data={rows} includeZero xKey="minutes" yKeys={["free", "pro"]}>
  <ChartGrid axis="both" color="#E5E5EA" />
  <ChartScatter color="#0A84FF" radius={5} yKey="free" />
  <ChartScatter color="#FF9F0A" radius={5} yKey="pro" />
</CartesianChart>;
One shape per row per series, on a numeric x. A whole series is one Skia path, so a hundred points is one node. A gap is the same shape at radius zero on the baseline, which is what keeps the series interpolatable when a datum comes and goes.
Shapes
<ChartScatter color="#0A84FF" shape="circle" yKey="a" />
<ChartScatter color="#30D158" shape="square" yKey="b" />
<ChartScatter color="#FF9F0A" shape="star" yKey="c" />
Each shape is built on a fixed verb sequence, so a series that changes shape morphs between them.
Radius per point
<ChartScatter color="#0A84FF" radius={(point) => 3 + (point.yValue ?? 0) / 40} yKey="sales" />radius takes a number for every point, or a function of the point and its index for a bubble
chart. The point carries both its canvas position and its domain values, so a size read off the
data needs no inversion.
Rings
<ChartScatter color="#0A84FF" radius={6} strokeWidth={1.5} style="stroke" yKey="pro" />style="stroke" draws rings instead of discs, at strokeWidth.
API Reference
ChartScatter
Prop
Type