Area
The region between a series and a baseline — flat, faded, or stacked.
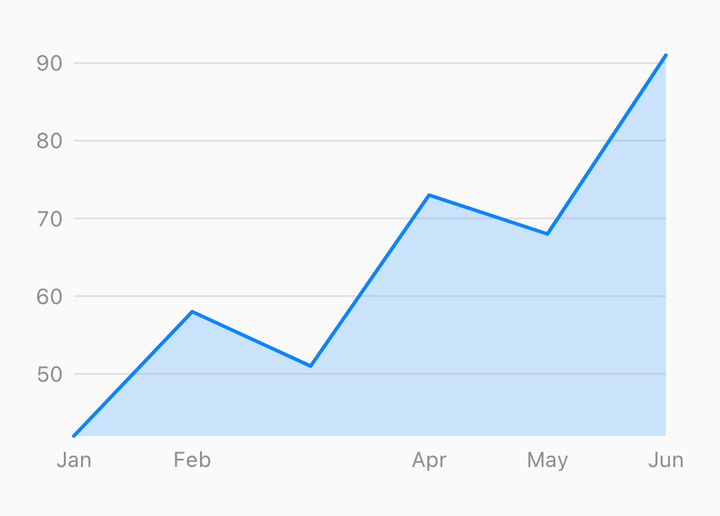
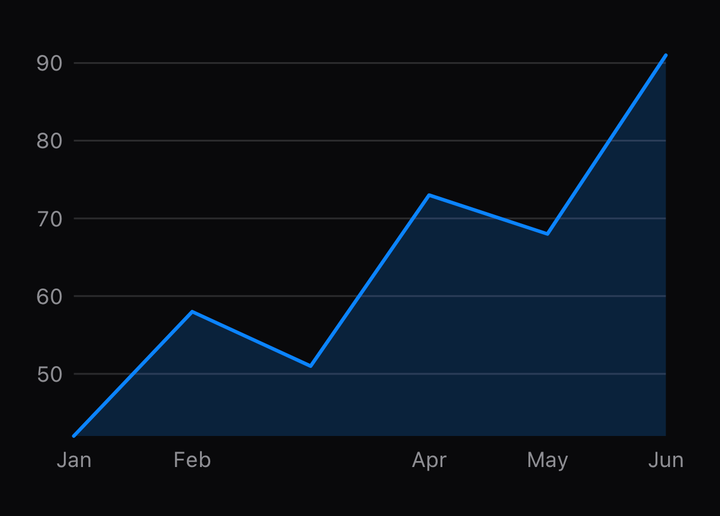
import { CartesianChart, ChartArea, ChartLine } from "@delacour/react-native-charts";

<CartesianChart data={rows} includeZero xKey="day" yKeys={["visits"]}>
  <ChartArea color="#0A84FF33" curve="monotone" yKey="visits" />
  <ChartLine color="#0A84FF" curve="monotone" yKey="visits" />
</CartesianChart>;
An area and a line over the same key, area first so the line sits on top. The fill closes against
the plot rect's bottom unless baseline says otherwise, and includeZero pulls zero into the
domain so the fill has somewhere to close to.
Gradient
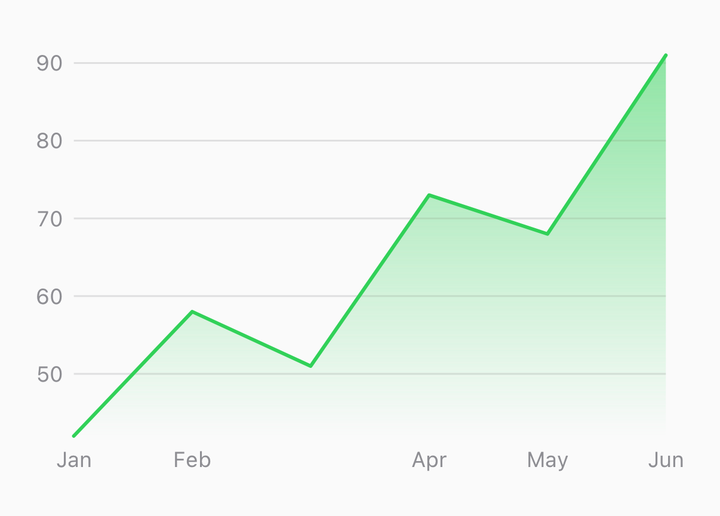
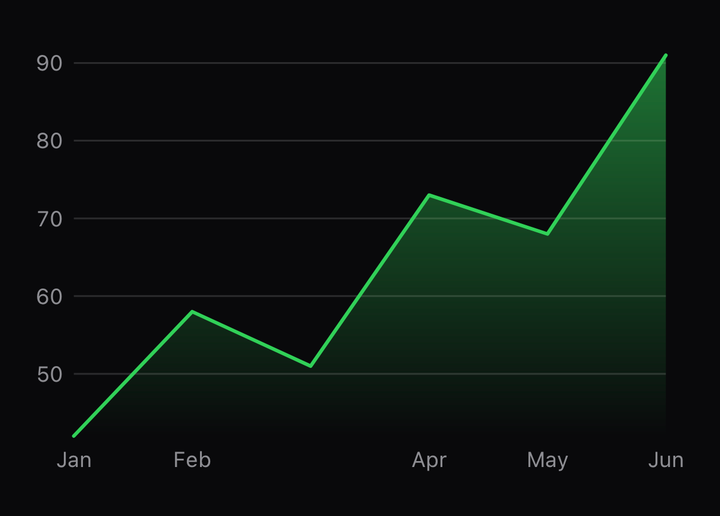
<ChartArea curve="monotone" gradient={["#0A84FF66", "#0A84FF00"]} yKey="visits" />gradient is a list of top-to-bottom stops; the last is usually transparent. Give color or
gradient, not both. The gradient runs the height of the plot rect, not of the path's own
bounds — anchored to the path, the same data would fade differently as the domain changed, and two
charts side by side would disagree about what a colour meant.
Baseline
import { scaleValue } from "@delacour/react-native-charts/core";

<CartesianChart data={rows} includeZero xKey="day" yKeys={["delta"]}>
  {({ points, yScale }) => (
    <ChartArea baseline={scaleValue(yScale, 0)} color="#30D15833" points={points.delta} />
  )}
</CartesianChart>;
baseline is a canvas y — an x on a horizontal chart. A fill that should close against zero
rather than the plot's bottom gets it from the scale, with scaleValue from
/core.
Stacked
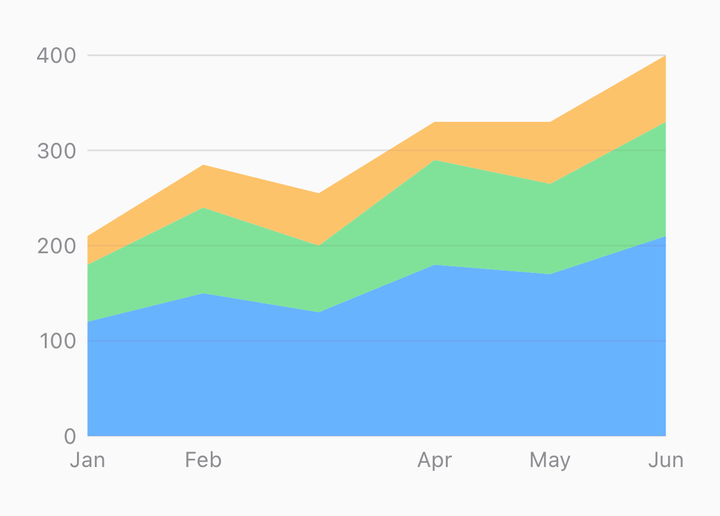
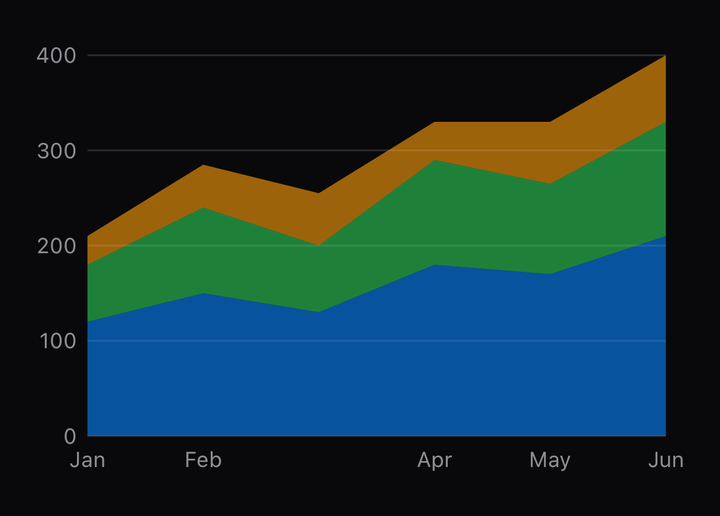
<CartesianChart data={rows} stackKeys={["desktop", "mobile", "tablet"]} xKey="day" yKeys={["desktop", "mobile", "tablet"]}>
  {({ stacked }) => (
    <>
      <ChartArea color="#0A84FF" curve="monotone" segments={stacked.desktop} />
      <ChartArea color="#30D158" curve="monotone" segments={stacked.mobile} />
      <ChartArea color="#FF9F0A" curve="monotone" segments={stacked.tablet} />
    </>
  )}
</CartesianChart>
The root stacks: stackKeys names the series, bottom first, and chart.stacked holds one band
per key, each from the top of the series below to its own running total. segments draws that
band. The y domain covers the totals, because the root built the scale after stacking — which is
the reason stacking is not a mark prop. See Composition.
API Reference
ChartArea
Prop
Type