Bar
One series per step, several side by side, or several stacked — standing on zero, either way up.
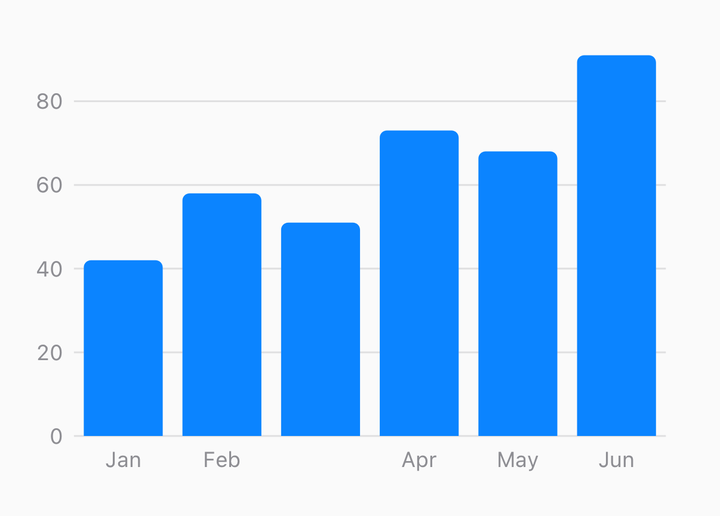
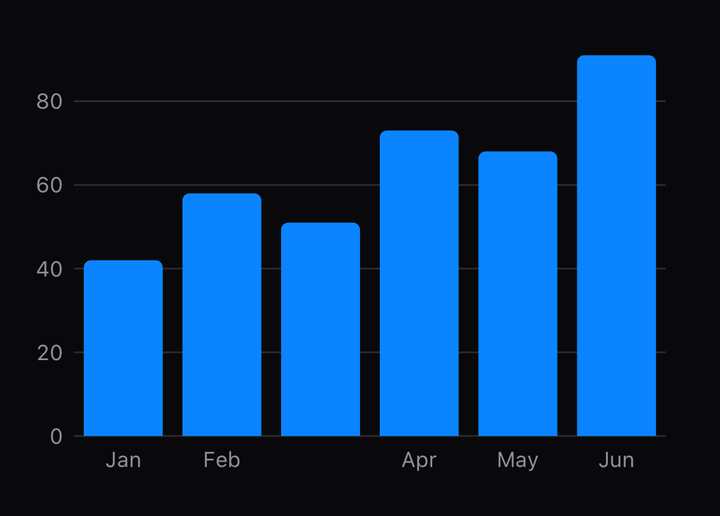
import { CartesianChart, ChartBar } from "@delacour/react-native-charts";

<CartesianChart data={rows} domainPadding={{ x: 0.5 }} includeZero xKey="month" yKeys={["orders"]}>
  <ChartBar color="#0A84FF" roundedCorners={{ topLeft: 4, topRight: 4 }} yKey="orders" />
</CartesianChart>;
Two root props do the work. includeZero pulls zero into the y domain, because a bar's length is
read against the axis and one that starts at 40 exaggerates every difference. domainPadding of
half a step each side is what puts the first and last bars inside the plot rather than straddling
its edges — the domain the root measures ends exactly at the outermost data.
Without domainPadding={{ x: 0.5 }} the outermost bars are drawn half outside the plot.
ChartBar warns in development and names the prop; a release build draws them clipped and says
nothing.
Every bar in a series is one path, and every corner is a cubic — square or rounded — so a change of data morphs rather than snaps. A gap is a zero-height bar at the baseline for the same reason.
Grouped
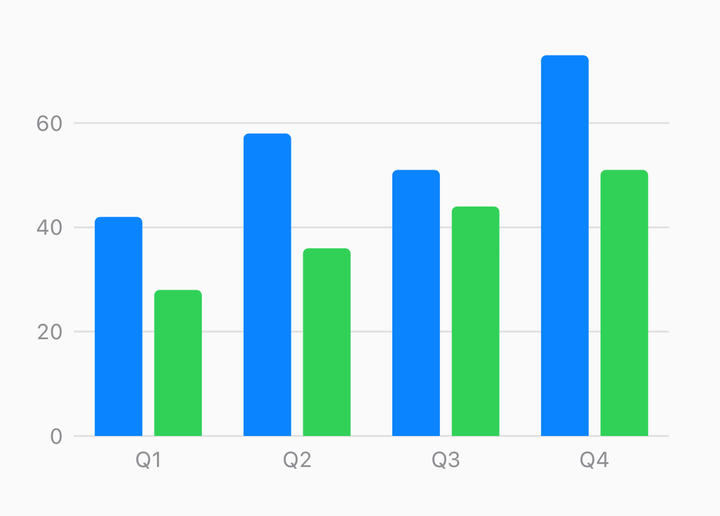
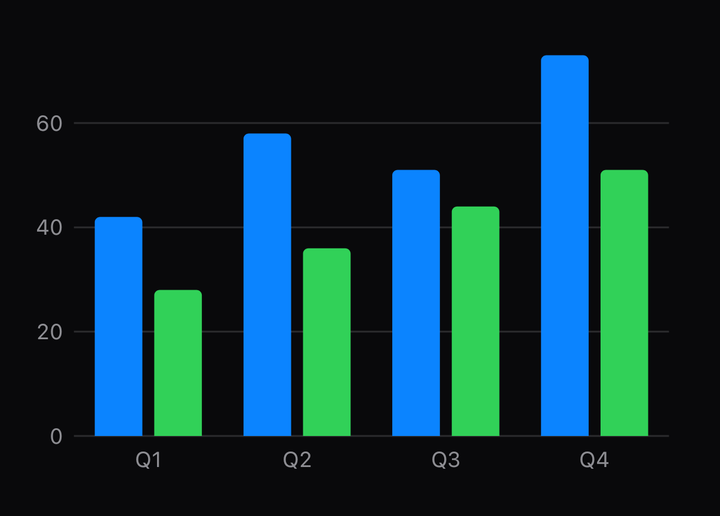
import { ChartBarGroup } from "@delacour/react-native-charts";

<CartesianChart data={rows} domainPadding={{ x: 0.5 }} includeZero xKey="month" yKeys={["desktop", "mobile"]}>
  <ChartBarGroup colors={["#0A84FF", "#30D158"]} roundedCorners={{ topLeft: 3, topRight: 3 }} yKeys={["desktop", "mobile"]} />
</CartesianChart>;
ChartBarGroup takes yKeys rather than child marks: the group has to know how many series
there are before any of them can know its offset. One path per series, so a series added or
removed morphs on its own.
Stacked
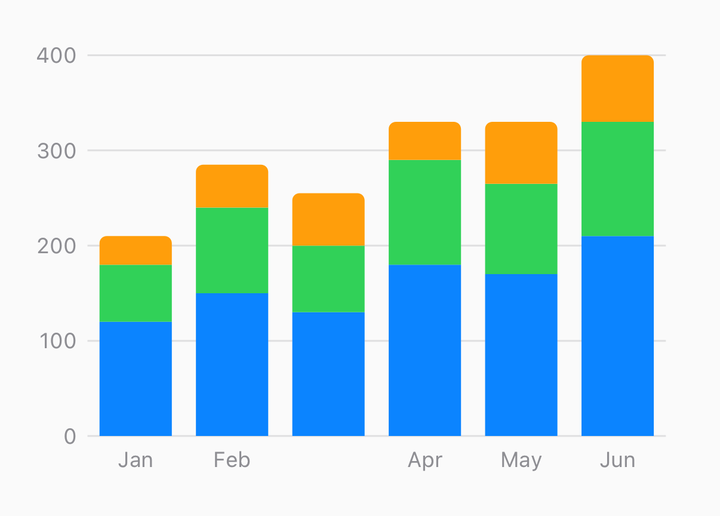
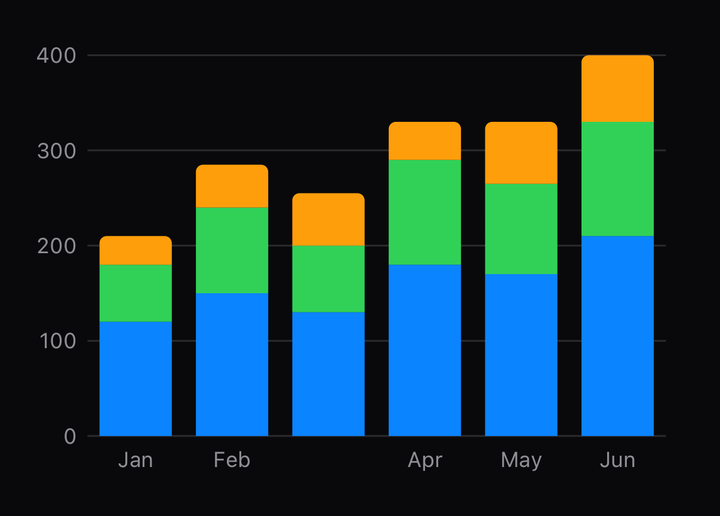
import { ChartBarStack } from "@delacour/react-native-charts";

<CartesianChart data={rows} domainPadding={{ x: 0.5 }} stackKeys={["organic", "paid", "referral"]} xKey="month" yKeys={["organic", "paid", "referral"]}>
  <ChartBarStack
    barOptions={({ isTop }) => (isTop ? { roundedCorners: { topLeft: 4, topRight: 4 } } : {})}
    colors={["#0A84FF", "#30D158", "#FF9F0A"]}
    yKeys={["organic", "paid", "referral"]}
  />
</CartesianChart>;
The root stacks and the mark draws. Every key in the stack's yKeys has to be in the root's
stackKeys, bottom first; a key missing from it has no stacked series and draws nothing.
barOptions is called per segment, and rounding only the one with isTop is what makes a column
read as one bar rather than a pile of pills. Positives climb from zero and negatives descend from
zero on separate totals.
Horizontal
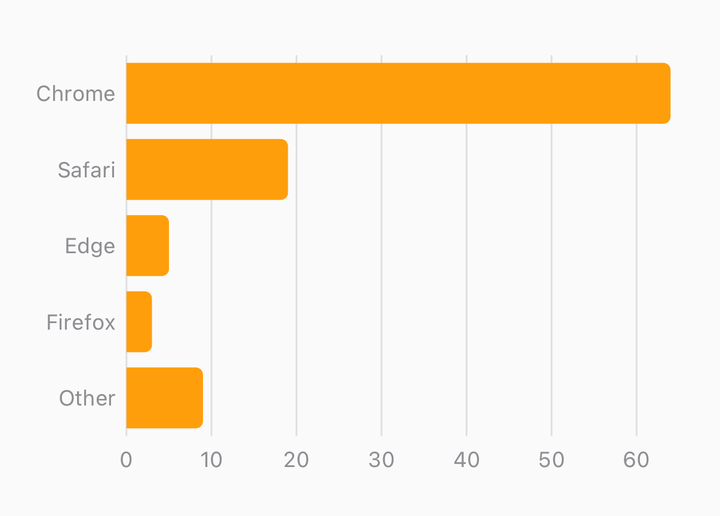
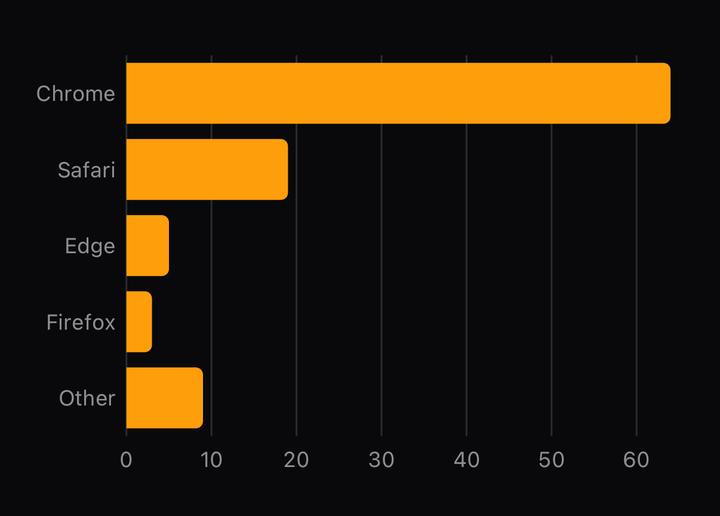
<CartesianChart data={rows} domainPadding={{ x: 0.5 }} font={font} includeZero orientation="horizontal" xKey="browser" yKeys={["visitors"]}>
  <ChartGrid axis="x" color="#E5E5EA" />
  <ChartYAxis color="#8E8E93" />
  <ChartXAxis color="#8E8E93" />
  <ChartBar color="#0A84FF" roundedCorners={{ topLeft: 4, topRight: 4 }} yKey="visitors" />
</CartesianChart>
orientation="horizontal" swaps the axis roles at the root: the categories run down the left,
top row first, and the values along the bottom. Nothing else changes — xKey still names the
category field, domainPadding.x still pads it, and roundedCorners.topLeft is still the value
end. ChartYAxis now labels the categories and ChartGrid axis="x" rules the values.
Labels
<ChartBar
  color="#0A84FF"
  labels={{ color: "#8E8E93", formatLabel: (point) => `$${point.yValue}k`, gap: 4 }}
  yKey="revenue"
/>
labels prints a value against each bar in Skia text, in the chart's font unless given one of its
own. position defaults to top, the value end, which flips below a negative bar. Return ""
from formatLabel to skip a bar. A group and a stack draw no labels: a series there is one path,
and a path has one colour and one opacity — per-datum text would need a node per bar, which is
what one-path-per-series exists to avoid.
API Reference
ChartBar
Prop
Type
ChartBarLabels
Prop
Type
ChartBarGroup
Prop
Type
ChartBarStack
Prop
Type